")
")
")
")

In the next sections you will find a number of questions:
- How to define the sector?
- How to collect data on the sector?
- Who shall predict the future demand?
- When to estimate quantities in labour demand?
- How to estimate quantities in labour demand?
- How to work with the influence of market dynamics?
that you can use in discussions within the sector in order to get a common picture of future demand. The questions are presented together with direct practical examples of good practice collected by the project partners during their research in the project. The intention of the questions is to assist you and other stakeholders in obtaining an overview of future demand, measured in quantities, in a structured and systematic way.
Sectors develop over time, new sectors emerge and old sectors disappear. Defining the 'sector' will sometimes be a challenge due to changes in its stability (or otherwise) and characteristics . Independent of the special characteristics of the sector you work in, it is important to clearly define the boundaries of the sector -including its blurred edges. For example, the Greek hospitality sector is defined[1] by its overarching role (importance, focus, related sectors, type of need covered) in Greek society and by a classification of job profiles (EQF-level, title, focus area), as the good practice below shows:
Good practice: The Greek hospitality sector (kitchen staff in hotels & restaurants)
Table 1. Classification of job profiles in hostipality sector (Greece)
| EQF Level | Food |
| 2 |
Kitchen porter
|
| 3 |
Cook/Chef de partie
|
| 4 | Head chef/Chef de cuisine/Professional cook |
| 5 | Executive chef |
Source: WP4 – National Report – Greece - 2020
The defining of the sector is done by sector mapping - but the map itself should be part of the evaluation: is it still an adequate representation?. “The most beautiful flowers always grow at the edge of cliffs and canyons” - i.e. the dynamics of VET and labour usually happen along the margins of definitions as to what is included and what is not. Therefore, a key aspect of sectoral definition must include discussions about sectoral boundaries and include major developments in the sector definition.
It is important that you get the sector defined as clearly as possible. The good practice example from Greece can inspire how to structure this approach, providing some key dimensions of the definition and especially by its classification of job profiles, education and titles used within the sector.
The Italian good practice example below shows how stakeholders in the sector can contribute to its definition and the EQF-levels for different positions and jobs within it:
Good practice: The Italian Finance and Bank sector
The EQF levels identified are based on the “Manual for the Certification of Commercial Banks Qualifications”, realized by ABI (Italian Banking Association). The recommendations provided by ABI regarding the EQF levels do not represent a consolidated point of reference at National level.
Source: WP4 National Report – Italy 2020
How to collect data on the sector?
The National Report on the Swedish Electrician sector shows a range of challenges regarding data collection with respect to the educational side and the demand measured by the number of students needed by the enterprises.
It has been found that other sectors have experienced seen similar challenges, whereas some sectors have a good level of data and statistics to build on.
Good practice: The Swedish Electrician sector
It proved to be very hard to get grip on relevant data and statistics. The sector does not have specific data on sector segments or occupations so it is not clear how many electricians per year are needed to enable the sector to grow, or replace those that leave it. At the same time the branch organisation claims there is room for 10.000 extra workers in the sector as a whole, which is 20% of the current population of ± 50.000 workers!
The Skolverket website (the VET agency of the Ministry of Education) reports that there were 4.501 students in the 3rd year of their El+E program (4.367 ♂ 134 ♀) spread over 195 schools in 150 different towns (April 2019). This means an average of (just) 23 students per school.
The schools state that 50% of their students become an electrician immediately after graduation and another 25-30% do so after some time. These figures are confirmed by the branch organisation with the addition that the ETG-variety (450 alumni last year) has a higher score than the standard programme: 90% immediate inflow as an electrician. This means 80-90% actually reach the destination they are trained for, but 10-20% are lost to the sector (except for the students choosing further training at a higher level in the same field).
Apparently, the inflow of 3.500-4.000 graduates that is assumed per year is insufficient to cover open vacancies. This is supported by findings that demonstrate that students are(very) confident about finding a job as an electrician and that all companies are yearning for graduates and (good) trainees.
Source: WP4 National Report – Sweden 2020
You can be encouraged by this good practice example. It sets out an approach to arriving at an authoritative and clear conclusion from available evidence for the need for more students, yet at the same time still lacks more detailed data to support its conclusion. This is both a situation and paradox that those planning for quantity will face.
Who shall predict the future demand?
It is important that there is cooperation between enterprises, employers and sector representatives to make predictions about future demand. It is necessary to have a joint view about various aspects, in terms of which way the future will go. This can be done simply, for instance by asking employers and sector representatives to participate together in exercises such as surveys.
It is reasonable to expect that sectoral enterprises will have a strategy for the coming years and thereby be able to offer qualified insight and requirements on future demand.
Sectoral organisations such as associations often analyse the development of their members’ individual enterprises as a whole and consider the context in which the sector operates. Most sectors are influenced by what is taking place in other sectors and by developments in their local, regional, national and international economies. Therefore, it is useful to use such data to find out how these areas expect to evolve in the future and to reflect on how this can and will influence the sector concerned.
When to estimate quantities in labour demand?
Generally, VET provision takes between two to four years to become established, depending on the field of learning, country and sector. This fact sets the scene and illustrates one of the major challenges regarding when to estimate the future needs and to react proactively on these estimates.
Some trends are predictable, however in most sectors the timespan between the length of the education planning and implementation process and the future need of supply is still challenging and very difficult to forecast.
How to estimate quantities in labour demand?
Estimating the demand for the number of staff needed in the future is not easy and can pose challenges for individual enterprises or for their sector representative organisations.
Even if the questions regarding the future and current numbers of staffing are relatively easy to identify, specific data about this issue can often be complicated to find. Statistics regarding employment data are available in most countries that enable relevant data to be found, not only on a country level but often on a sectoral level. This data can describe who is employed/unemployed and often include other demographic variables such as age and gender etc. However, such figures are typically aggregated and the sector definitions being used do not always fit a sector's own definition of itself. Still, these statistical figures are good indicators of the current situation in the sector and can, combined with data on age and retirement practice, give a picture of the future employment based on the analysed trends.
Additionally, sectoral organisations and trade unions can sometimes be good source of data providing useful overview on the current employment trends within sectors in relation to age, particularly the data concerning retirement as analysed in the context of staff supply and demand.
Current and expected employment and unemployment rates within different sectors can also be a good indicator for future demand. The good practice example from the Italian Finance and Bank sector illustrates it below
Good practice: The Italian Finance and Bank sector
- Quantitative data
Statistics on labour
|
EQF |
Occupation |
# |
% |
# |
# |
Hard |
|
5 |
Dir. Gruppo di Agenzie/DGA |
997 |
100 % |
? % |
0 |
0% |
|
4 |
Direttore di Filiale/DAG |
24.932 |
100 % |
? % |
0 |
0% |
|
3 |
Vice Direttore di Agenzia |
17.452 |
100 % |
? % |
0 |
0% |
* vacancies open for longer than 6 months
Direttore di Filiale/DAG (Branch Manager): there is one manager in each bank’ branch. Currently, the total number of banks’ branches distributed among all the Italian Regions, is 24.932.
Branch Vice-managers corresponds approximately to the 70% of the Branch Managers (i.e. 17.452 in total), although in every bank branch there is a “Substitute acting as vice-manager” (i.e. 24.932 in total).
Dir. Gruppo di Agenzie DGA (Area Branch Coordinator Manager): Branches’ group is composed of an average of 25 branches. Therefore, Managers of branches’ groups are currently 997.
All the data collected are updated to the 4th of January, 2019.
Source: WP4 National Report – Italy 2020
The good practice example from the Italian Finance and Bank sector sets out to show very accurate and precise numbers of staff based on the number of branches and their method of organising the work. The data is relatively recent and show how a sector can deliver up-to-date data compared to publicly-available statistics, which can often be quite old.
The hospitality/tourism sectors are very dependent on national and international mobility as the Coronavirus crisis has clearly shown. Pandemics such as Coronavirus (Covid-19) are extremely difficult to anticipate, yet the impact it has had on economies, and especially on the hospitality/tourism sectors has been immense.
The good practice example below illustrates show how Greece has worked to estimate its future demand, utilising questionnaires for employers and students
Good practice: The Greek hospitality sector
Statistics on labour
The following data has been collected by Greek Statistic Authority (2016) and has been estimated at national level.
Table 2. Type and amount of enterprises in food-related hospitality sector in Greece
|
Type of enterprises in sector in Greece |
Number of enterprises |
Number of employees |
|
Restaurants and mobile units |
41.171 |
209.182 |
|
Catering services |
3.435 |
11.428 |
|
Fast food services & Cafe |
81.593 |
379.041 |
|
Total |
126.199 |
599.651 |
Table 3. Number of employees in hospitality sector in Greece
|
Type of enterprises in sector in Greece |
Number of enterprises |
Number of employees |
|
Restaurants and mobile units |
41.171 |
209.182 |
|
Catering services |
3.435 |
11.428 |
|
Total |
44.606 |
220.610 |
Table 4. Number of employees per EQF level
|
EQF |
Occupation |
# |
% |
# |
# |
Hard |
|
4 |
Head chef |
9.854 |
86% |
N/A |
N/A |
80% |
|
3 |
Cook/chef de partie |
47.359 |
64% |
N/A |
N/A |
60% |
|
2 |
Kitchen porter/assistant |
163.397 |
11% |
N/A |
N/A |
30% |
|
*There is not any available data per occupational profile. The statistical interpretation of the data related to work placement and vacancies are provided in total. **DIMITRA’s approach based on iVET data |
||||||
According to DIMITRA's data, the majority of graduated students (approx. 90%) are placed in seasonal workplaces either in Greece, especially in islands and coastal areas, or abroad, especially on cruise ships or river cruise ships.
The good practice example from Greece shows how official national statistics on the type and number of enterprises and employees can give a good overview of the current sector - or at least how the sector looked like a few years ago.
Another example of good practice is the national report on the hospitality sector in the UK that gives an excellent overview of the sector on a number of key issues.
Good practice. The Hospitality Sector in UK
In summary, the Hospitality Sector has the lowest proportion of full-time employees of all sectors, and
- Employs a particularly young workforce (33% <25 years old); 10% are employed on a temporary basis.
- The majority of establishments in the sector (approx. 91%) employ fewer than 25 people.
- Is relatively low-skilled – only a fifth of the workforce are qualified to level 4 and above, though this varies by sub-sector.
- In terms of recruitment issues, 32,700 establishments (15% of all sector establishments) have vacancies; 5% report hard to fill vacancies, with 3% reporting skills shortage vacancies.
- A total of 73,700 vacancies were reported across the sector; a quarter of these (18,243) are hard-to-fill and a further 15% (11,178) are skills shortage vacancies.
- The incidence of workers not fully proficient in their roles: 43,000 establishments (one fifth) report having skills gaps (194,000 (8%)).
- Skills are being adversely affected by a number of factors, including temporary employment, transient workers, poor retention rates and low skills utilisation
- 61% of employers provide training
- Restaurants are slightly less likely to provide training (50%)
- 85% of employees receive health and safety/first aid training
- 63% of employees receive induction training
- By far, the reason employers to not provide training is that they say that staff are fully proficient (62%)[1].
Source: WP4 The National Report – UK - 2020
This example of a comprehensive overview can be used to inspire you to search for a similar strategic and operational overview of your sector.
Different types of employment data
A number of factors that can be used to describe the employment situation in detail, such as age profile, gender, contracts etc. Selected topics are presented below:
Age profiler
The age profile and retirement praxis of current employees can indicate when staff are leaving employment in the sectoral enterprises. The current age profile is important in assessing the future demand for staff and skills, as the good practice example from the Italian Finance and Banking sector shows below
Good practice: The Italian Finance and Bank sector
AVERAGE AGE
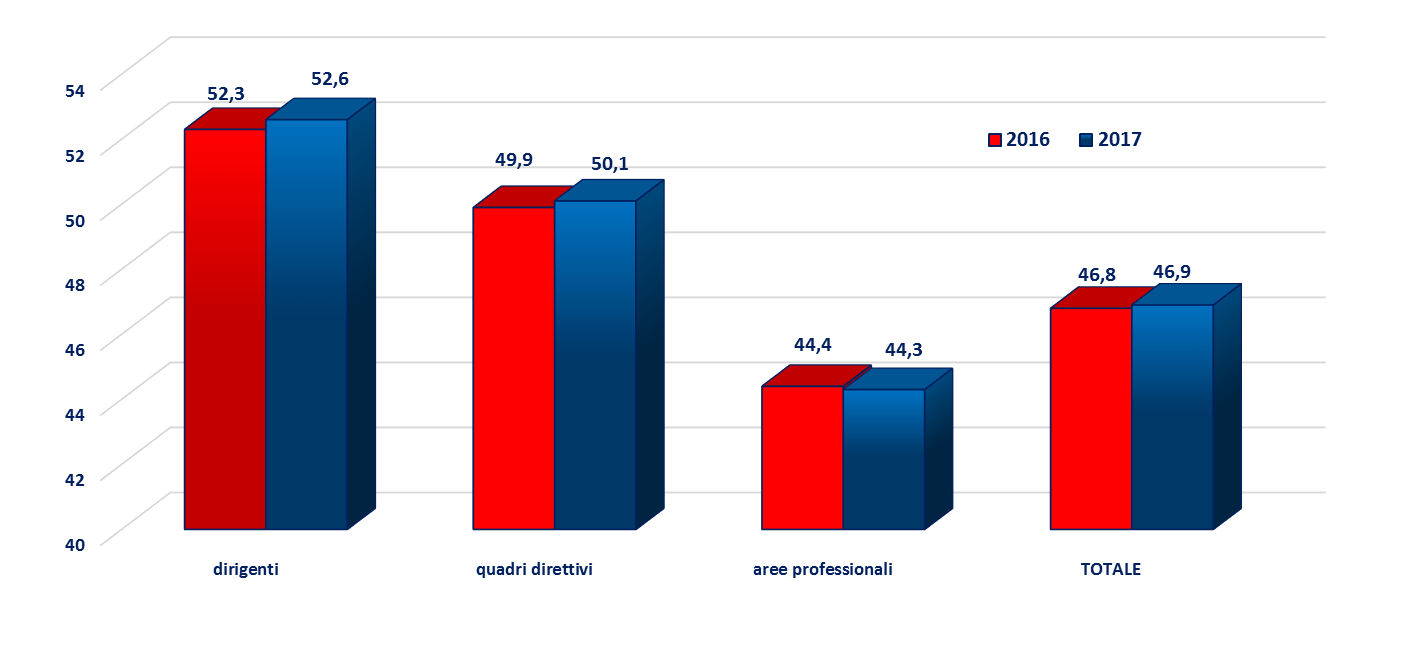
The Italian Finance and Banking sector have comprehensive data on the age of their staff. Based on these figures it is possible to predict when people will leave (retire) and when new staff and skills might be needed.
Gender
Gender is a key issue in the Italian Finance and Banking sector as the good practice example below shows:
Gender
Gender is a key issue in the Italian Finance and Banking sector as the good practice example below shows:
Good practice: The Italian Finance and Bank sector
COMPOSITION OF THE WORKFORCE BY GENDER (Years 1997 – 2016 – 2017)
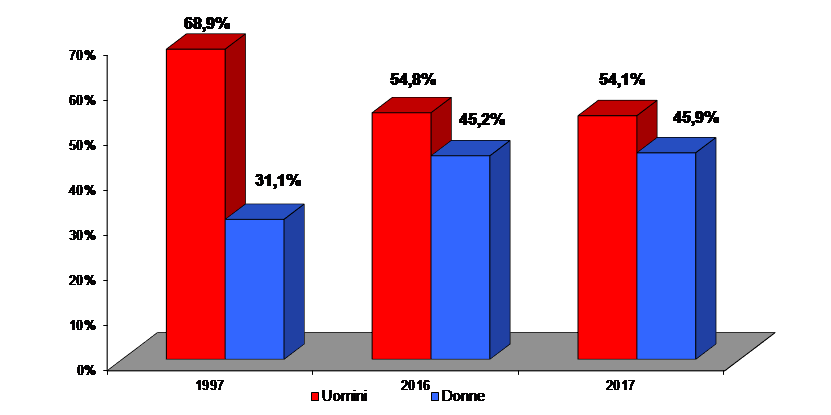
statistics on gender and the development from this sector show an increase of some50 % in the proportion of females employed between 1997 and 2017. This is a good indicator for the future demand of staff from a gender balance perspective.
Most enterprises gather employment data. Such data can be very useful in forecasting demand and supply for staff based, for example, on retirement data. Surprisingly, none of the three sectors we focused on were able to deliver data in this context systematically and in a structured way.
The value of structured and systematically-gathered data on factors such as employment, unemployment, age and retirement practice cannot be underestimated, particularly in the context of forecasting further demand and supply in an evidence-based way.
How to work with the influence of market dynamics?
Constant technological advancements can influence both the number of staff needed and the skills and competences required. For example, in the banking and finance sector, the development in home banking in many countries has led to decreased demand for front-line staff in branches and, in some instances, has resulted in the closure of a number of branches. Consequently, in recent years, the banking and finance sector has changed significantly. Home/internet banking, internet trade and public regulations have influenced the number of staff and skills required. Some of these changes can be predicted relatively simply, whereas other are more complex.
The good practice example from the Italian Finance and Banking sector shows how changes in technology can influence the demand for staff, both in terms of numbers and skills
Good practice: The Italian Finance and Bank sector
The current situation in the banking world, where banks are merging in groups and consequently several branches are disappearing, results in lower levels of recruitment and redundancies. Moreover, new perspectives and work modalities (such as 'smart' working) are increasingly becoming prevalent amongst banks. From this perspective, and taking into account the ever-changing world that is permeated by new technologies, the need for employees to possess/acquire the right skills and competences is greater than ever.
Source: WP4 National Report – Italy 2020
This development, together with changes in the demand for quality in skills (covered in the section on EQAVET Indicator 6) will have huge consequences for the staff employed in the Italian Finance and Banking sector, when measured by the number of staff needed in the near future.
Another example: The sector employing electricians is, in general, a broad one that is characterised by the need for certification. Generally, education and training that leads to certified qualifications in this sector comprise both academic and professional rights.
The sector has a very broad range of clients from private households to professional industries. The working tasks have changed radically.
Over the years, technological advancements (e.g., automation) have also influenced this sector, particularly in the context of the new skills required. Nowadays, many electricians work in the areas combining a range of new technologies with traditional electrical skills.
The National Report on Electricians in Sweden describes a number of expectations that exist 'on the job'. The good practice example from Sweden illustrates, as with the good practice example from Italy, a number of changes that can predicted, but it is still difficult to decide as to how to react and, especially, how to realise the dramatic consequences these changes will often have:
Good practice: The Swedish Electrician sector
Job content
Short term changes expected in the profiles to be supported by VET content
- More attention for service and maintenance
- New regulations (EU)
- Sustainability
- Energy saving
- Energy production)
- New products and materials
- Electric cars (loading devices)
- LED lighting
- New techniques
- Remote control
- Servo steering
- Solar power (3x)
- ‘Smart buildings’
It is clear that there is a world to win in terms of quantity. It became also clear that there is a rapid growth in different new regulations, materials and techniques that are finding their way into future job descriptions as well as to the curricula and learning material of VET programmes.
Source: WP4 National Report – Sweden 2020
The demand requirements can be solved in many ways, ranging from employing students from traditional education and training pathways, to re-training and re-skilling staff from other sectors.
What is the staffing practice and how does it influence the demand measured in numbers?
In addition to the good practice example from the UK presented above, some key questions from the national reports, the interviews and the research have emerged:
- How do you weight all the different information to make an estimate ?
- And who is responsible for the potential effects of wrong predictions and who covers the costs that arise?
The national report on the hospitality sector in the UK present students’ career attitudes to a career in hospitality sector, and a number of activities to match supply with demand:
Good practice. The Hospitality Sector in UK
In June 2019 the Entry Level Talent Campaign was launched by one of the UK’s prominent Hospitality Sectors and largest online recruitment solutions[1] Caterer.com to deliver the results of their latest research and engage high profile professionals[1] within the sector through panel discussions before an audience of nearly 100 industry professionals[1]. Key research findings include:
- 97% of school aged children and recent school leavers had written off Hospitality as a career option at a very early stage.
- Parents play a significant role in the decisions that young people make in terms of their career, therefore schools, through competitions, for example, can inform and inspire parents.
- Employers can better attract talent by reinforcing the message by going into schools to promote Hospitality as a career and to train people from the industry as ambassadors who can express the virtues of Hospitality as a career option.
- UK Hospitality is working with UK Government on policy areas on immigration and the future structure of immigration policy, and vocational education and the decline of the vocational training offer over the past 20-years, which has resulted in migrant workers from the European Union.
Source: WP4 The National Report – UK - 2020
It must be inspiring for you to see how to tackle the situation when looking at the proportion of school aged children and recent school leavers that had 'written off' your sector as a career option. It must be inspiring too, reading how parents, employers and sector organisations can work on getting more students attracted to the sector. Such data highlight probable supply shortages and exemplifies how parents, employers and sector organisations can work together on attracting more students to the sector.
A number of different data on quantities in labour demand have been presented in the sections above. The most important matter is how the data are used, which the different good practice showed in this section.
| Previous | Next |